
Investment insights: December 2023 quarter
Qantas Super had a strong end to the 2023 calendar year, with each of our investment options posting strong gains over the December quarter.
After a difficult end to the March 2020 quarter, investment markets rebounded during the June 2020 quarter, allowing each of Qantas Super’s investment options to make some gains to close out the 2019/20 financial year.
While falls in share markets were the talk of the March 2020 quarter, Qantas Super investment manager Chris Grogan said the June quarter was the “polar opposite”.
Share markets and private equity performed well from April to the end of June, buoyed by the fiscal stimulus from Governments around the world, news of different countries easing restrictions, and positive developments on a COVID-19 vaccine.
Once again, this shift highlights the importance of building well diversified portfolios with investments that complement each other. Qantas Super’s investment options are invested in over 5,000 investments globally, which in addition to shares, also includes property, infrastructure, timberland, agriculture, a variety of bonds, and cash.
Having your super spread across different types of investments helps smooth the ups and downs that may be experienced by any one type of investment, and helps your super to perform over the long-term.
As at 30 June 2020 – all returns are per annum and after investment fees.
| Investment option | 1 year | 3 years | 5 years | 6 years | 7 years | 10 years |
|---|---|---|---|---|---|---|
| Glidepath: Take-off | -2.8% | 5.8% | - | - | - | - |
| Glidepath: Altitude | -1.6% | 5.3% | - | - | - | - |
| Glidepath: Cruising | -1.0% | 5.1% | - | - | - | - |
| Glidepath: Destination | -0.9% | 4.5% | - | - | - | - |
| Aggressive | -2.8% | 5.8% | 5.8% | 6.4% | 7.6% | 7.9% |
| Growth | -1.6% | 5.3% | 5.3% | 5.7% | 6.6% | 7.0% |
| Balanced | -0.9% | 4.6% | 4.4% | 4.8% | 5.6% | 6.1% |
| Conservative | 0.1% | 3.9% | 3.8% | 4.0% | 4.4% | 4.9% |
| Cash | 1.2% | 1.6% | 1.6% | 1.7% | 1.8% | 2.4% |
Past performance is not a guarantee of future performance.
While 2019/20 may not have delivered the results members were expecting at the outset, it’s important to remember that the year has presented ‘unprecedented’ challenges.
That word may now be a cliché, but the summer bushfires, followed by floods and then a global pandemic, have been an historic, once-in-a-lifetime series of events that have up-ended not only investment markets, but many of the world’s norms, in a matter of months.
As the world looks to recover and take steps back to normal, Chris reminded us that it’s important to focus on super as a long term investment.
Despite the difficulties of the last six months, each of Qantas Super’s investment options continues to deliver over the long term.
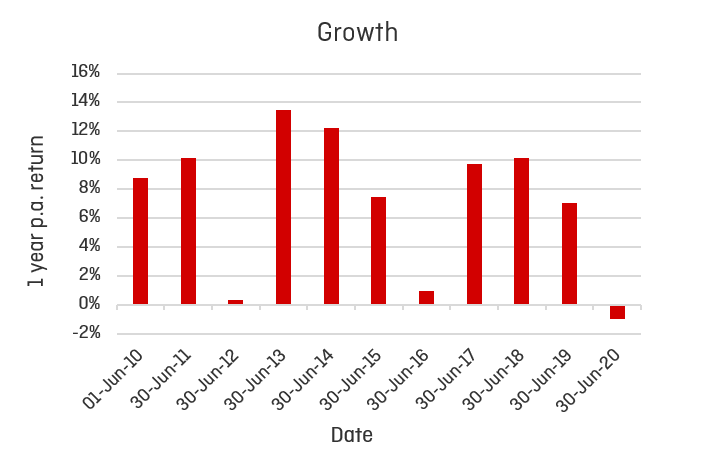
In fact, this is the first time in more than 10 years that our Growth option has delivered a negative return for a financial year, with the last dip into negative territory the result of the global financial crisis (GFC).
Though past performance is not a guarantee of future performance, history tells us that markets will recover over the long-term, as they did following the GFC.
This is visible in the following chart, which shows the one-year returns for our Growth option over the last 11 years.
While it may be tempting to invest in an option like Cash when the market is down, it’s important to remember that, not only are interest rates currently at an all-time low, but changing your investment strategy for even a short period can have a significant impact on your long-term outcomes.
We recommend you seek expert financial advice before making decisions about your investment options.
As at 30 June 2020 – all returns and objectives are per annum and after investment fees.
| Investment Option | Return objective | Actual return | Return objective | Difference |
|---|---|---|---|---|
| Glidepath: Take-Off | CPI + 5% over 10 years | 5.8% | 6.1% | -0.3% |
| Glidepath: Altitude | CPI + 4% over 7 years | 5.3% | 5.1% | +0.2% |
| Glidepath: Cruising | CPI + 3.5% over 6 years | 5.1% | 4.6% | +0.5% |
| Glidepath: Destination | CPI + 3% over 5 years | 4.5% | 4.1% | +0.4% |
| Aggressive | CPI + 5% over 10 years | 7.9% | 6.5% | +1.4% |
| Growth | CPI + 4% over 7 years | 6.6% | 5.5% | +1.1% |
| Balanced | CPI + 3% over 5 years | 4.4% | 4.3% | +0.1% |
| Conservative | CPI + 2% over 3 years | 3.9% | 3.1% | +0.8% |
| Cash | Bank Bill Index over 1 year | 1.2% | 0.7% | +0.49% |
As Glidepath was established on 1 October 2015, only three year returns are shown for these options.
All but one of our investment options are meeting their long term objectives. Once again, this highlights the importance of focusing on investing your super for the long term.
You can now subscribe to receive emails from us that suit your interests. From deep dives into the world of investments, to hot tips on getting the most out of your super, there’s a super topic for you!
Qantas Super had a strong end to the 2023 calendar year, with each of our investment options posting strong gains over the December quarter.
Markets kicked off the 2023 calendar year on a positive note, with each investment option almost doubling their return for the year to date from the December 2022 quarter to the end of March 2023.
After several years of volatility in investment markets, with returns swinging from negative to record highs, and back to the low single-digits, the 2022/23 financial year has seen a return to what we could consider more ‘normal’ numbers, with Qantas Super delivering strong absolute returns across all investment options.

Can’t get enough of the numbers? Take a look at all our performance figures.

Our safety-first investment ethos guides how we manage and grow your investments

Discover our range of investment approaches, tailored to your financial goals