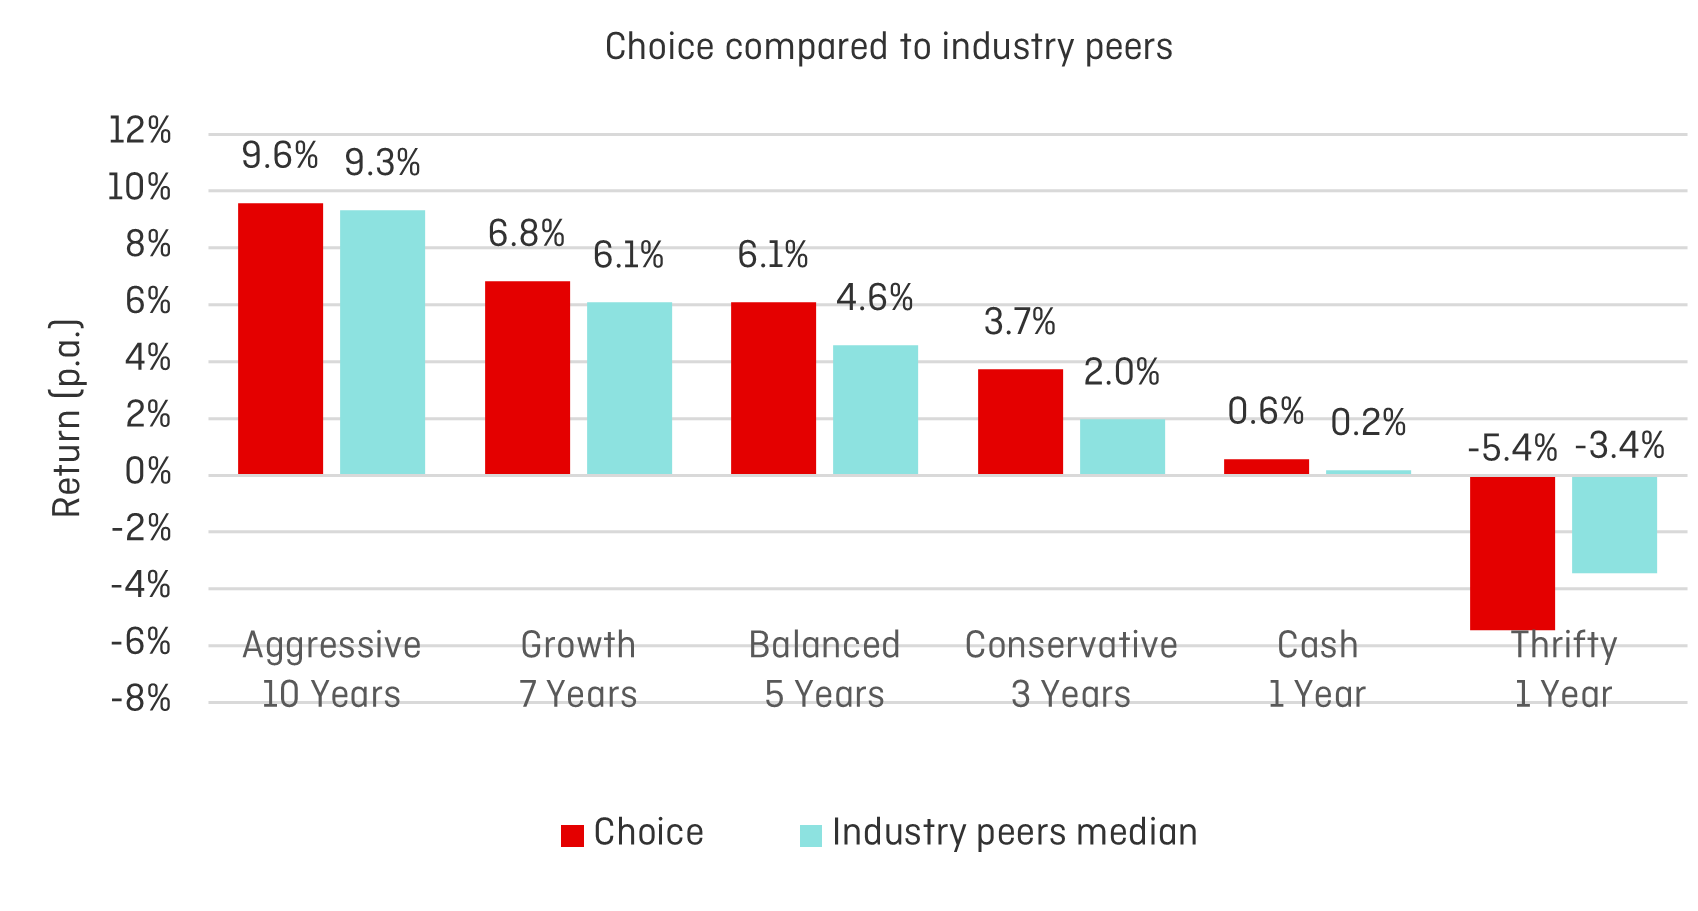
We have assessed each choice investment option separately. We have taken this approach so that each investment option can be more easily compared to industry peers. We used survey data from SuperRatings as the basis for our assessment of our choice products.
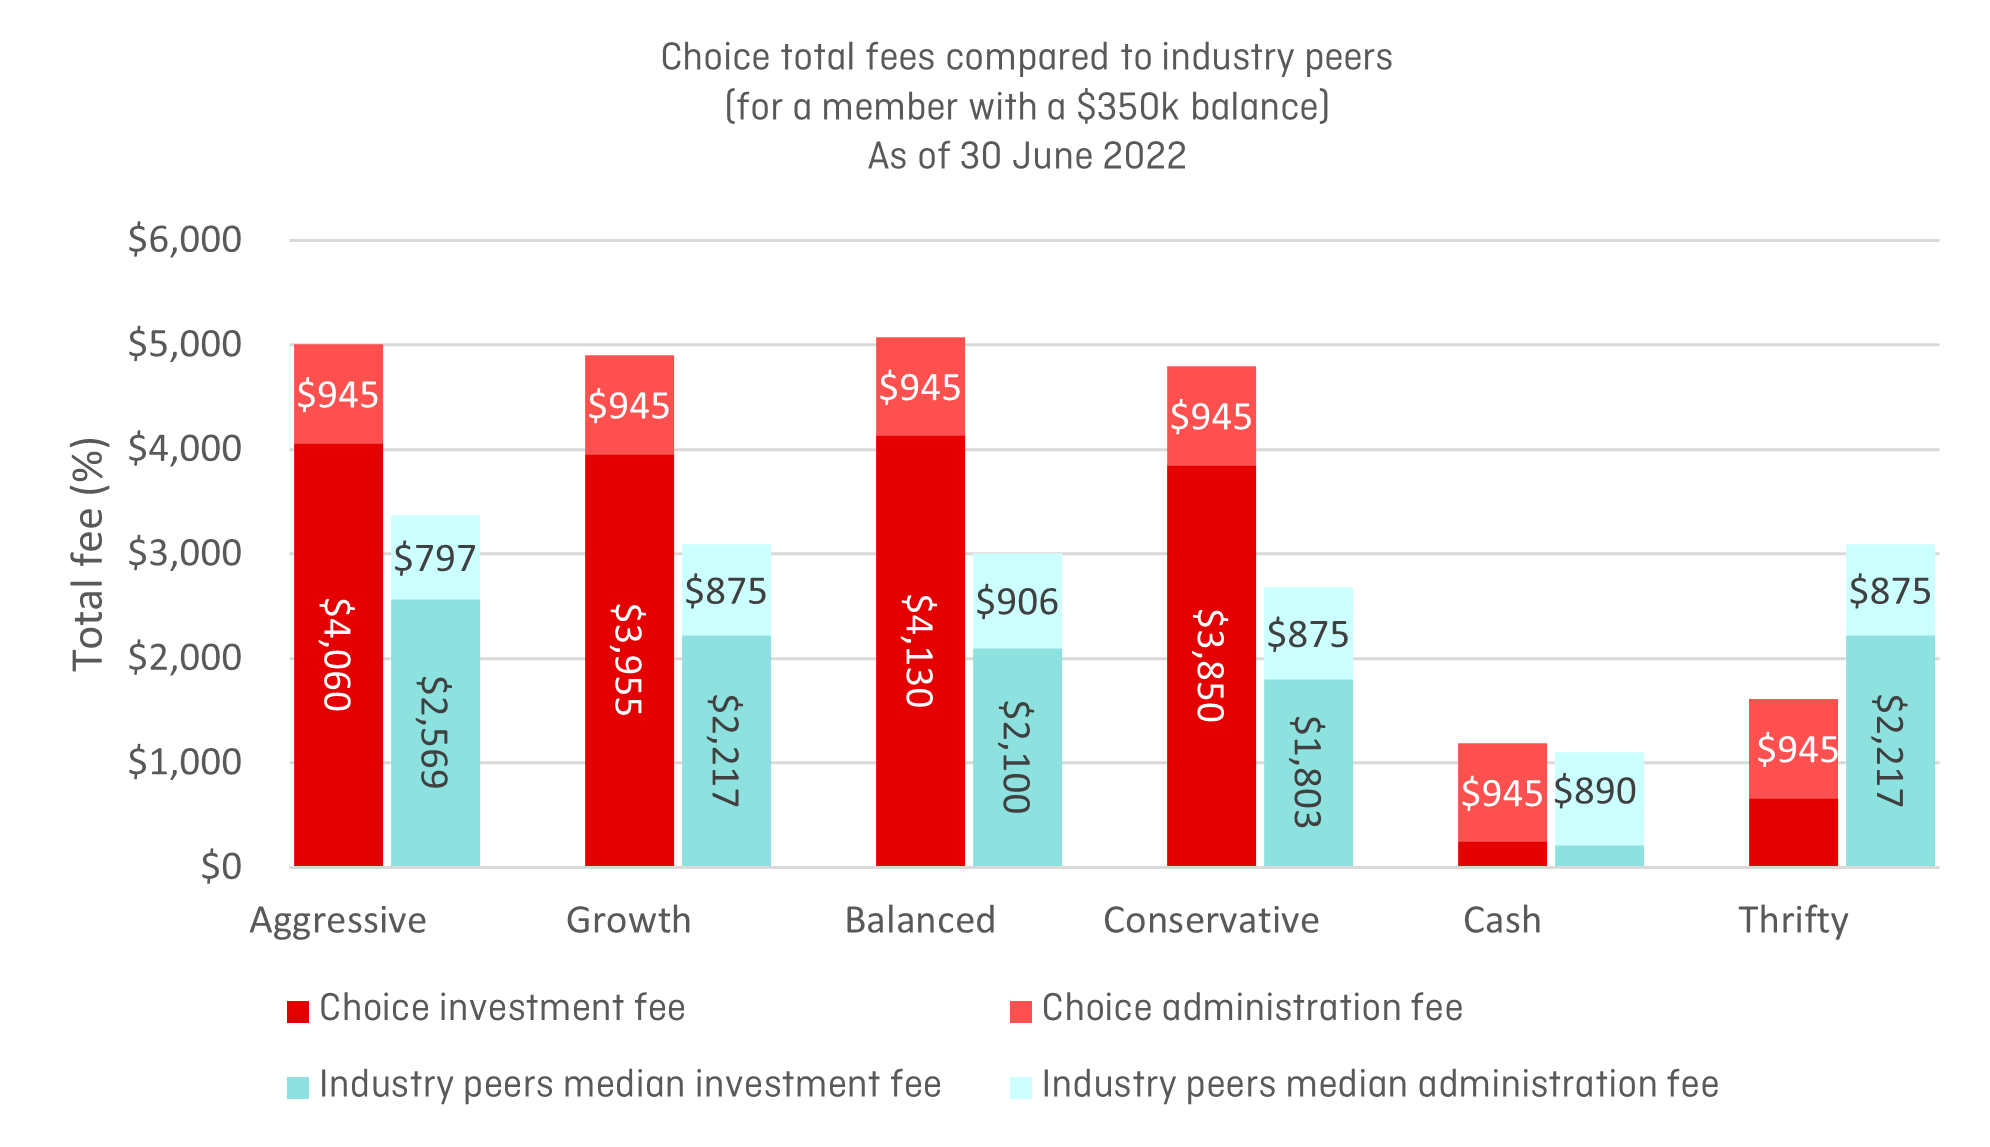
Fees (i.e. which includes investment management fees, investment performance fees and administration fees), for our choice product are shown below in dollar terms for a member with a $350,000 balance (a balance bracket that is closest to the average balance of members in our choice product).
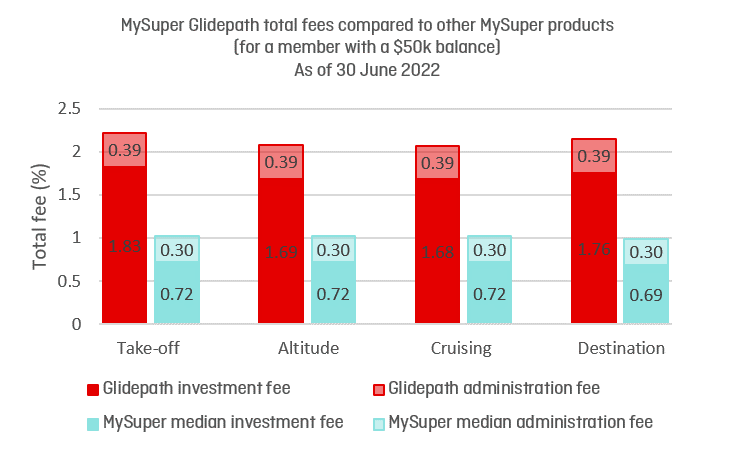
Qantas Super’s total fees for the established choice investment options at 30 June 2022 were significantly higher than the median fees of comparable products in the industry. In the FY2020/21 Member outcomes assessment, our choice product total fees were only modestly higher than those of industry peers. The change from FY2020/21 to FY2021/22 is a direct result of the excellent investment performance achieved during FY2021/22, which in turn led to an increase in investment performance fees attributed to our external investment managers. It is important to note that the excellent investment returns shown previously in this FY2021/22 Member outcomes assessment are after investment management fees and investment performance fees have been deducted, and are also net of tax.
In addition, Qantas Super’s investment fees reflect our well diversified investment strategy, which includes allocations to various alternative sub-asset classes. While the investments within these alternative sub-asset classes are more expensive than traditional asset classes, they have materially enhanced the returns of our investment options.
Total fees for our low-cost investment option Thrifty are significantly lower when compared to industry peers but in line with the total fees of other more passive industry peer options.