Qantas Super Explores Merger Options. Learn more.

Each year we are required to assess our performance, and based on that assessment, make an annual determination that we are promoting the financial interests of our members. A separate determination needs to be made for each product we offer.

We offer these products to members:

  • A lifecycle MySuper product, called Glidepath
  • A choice product with five investment options (Cash, Conservative, Balanced, Growth, Aggressive) that come in super and income account versions
  • Several defined benefit divisions that are closed to new entrants

Assessing our performance

In relation to our MySuper and choice products we have established a number of objectives and outcomes we aim to achieve for members that relate to the Plan’s:

  • Investment strategy and level of investment risk and return
  • Insurance strategy and fees
  • Fees and costs that affect the member returns
  • Options, benefits and facilities offered to members
  • Overall size and scale

We have assessed our performance against these objectives and outcomes for the year ending 30 June 2021. A summary of the assessment in each of these areas is set out in more detail below.

And in relation to our defined benefit divisions, we undertake a comprehensive Actuarial Review every three years and you can view the latest report here.

Investments

The investment-related outcomes assessment considers the Plan’s investment strategies and compares the risk and returns achieved by each investment option to comparable products in the industry.

Investment strategy

On a forward-looking basis the investment strategies for each investment option are consistent with its risk and return objectives. As at 30 June 2021 all investment options have a forward‑looking probability of 53-63% of meeting their stated return objectives over their recommended investment timeframes.

MySuper Glidepath risk and returns

We’ve assessed each stage of our MySuper Glidepath investment option separately. We have taken this approach so that each stage of the Glidepath can be more easily compared to other MySuper products. The outcomes and metrics on which we based this assessment are largely prescribed by the Australian Prudential Regulation Authority (APRA).

Investment returns

Our lifecycle MySuper product was launched on 1 October 2015, and the performance of these stages over the past three and five years net of tax, after investment fees, and after administration fees (assuming a $50k balance) is shown in the charts below. Our MySuper members received competitive, and in some cases first quartile, investment returns compared to other MySuper products over these periods.

3 year returns

Past performance is not a guarantee of future performance.

5 year returns

Past performance is not a guarantee of future performance.

The Government’s annual performance test came into effect for MySuper products on 30 June 2021 covering performance relating to the seven year period up to 30 June 2021. To derive a seven year MySuper performance history, the investment returns of our Growth investment option and Glidepath were combined. Our MySuper product passed this test.

Level of investment risk

Qantas Super has a safety-first approach to investing, which has generally delivered smoother returns to members. This can be assessed by reference to the standard deviation of returns, where a lower standard deviation means less volatility of returns. We observed that Glidepath has had a similar, or in some cases lower, standard deviation of returns compared to the median standard deviation of other MySuper products.

Past performance is not a guarantee of future performance. SuperRatings, the independent research house that provides this data, did not have sufficient information to publish results for the Cruising stage.


The level of investment risk was also assessed by estimating for each Glidepath stage the probability of experiencing a negative return over the next 20 years. Consistent with the standard deviation assessment, it was observed that the level of investment risk for Glidepath is comparable to other MySuper products within the industry.

Risk adjusted returns

Sharpe ratios are used to understand the return of an investment in relation to its risk, or in other words, an investment option’s risk-adjusted return. Generally, the greater the value of the Sharpe ratio, the more attractive the risk-adjusted return. All stages of Glidepath had Sharpe ratios that exceeded the industry median.

Past performance is not a guarantee of future performance. SuperRatings, the independent research house that provides this data, did not have sufficient information to publish results for the Cruising stage.

Choice risk and returns

Each investment option under our choice product was considered separately to make it easier to compare to similar products in the industry.

Investment returns

The chart below shows the net of tax and after investment fees returns that are applied to super accounts for each investment option’s relevant time horizon. The relative performance for income accounts is similar to these returns for super accounts.

Past performance is not a guarantee of future performance.

The performance for each investment option is competitive with other superannuation funds over each option’s relevant time horizon. In addition, the one year returns for our choice investment options were also excellent with each investment option ranked in the first quartile relative to peers.

Level of investment risk

The level of investment risk of the choice product has been assessed in reference to the standard deviation of returns, where a lower standard deviation means less volatility of returns. We also estimate for each investment option the probability of experiencing a negative return over a 20 year timeframe.

Overall, the level of investment risk for the choice product is comparable to other peer funds within the industry. While the Conservative option’s standard deviation outcome is modestly higher than the industry median, it is in line with peer funds when considering the expected number of negative returns over a 20 year timeframe.

Past performance is not a guarantee of future performance.

Risk-adjusted returns

Sharpe ratios are used to understand the return of an investment in relation to its risk, or in other words, an investment option’s risk-adjusted return. Generally, the greater the value of the Sharpe ratio, the more attractive the risk-adjusted return. All investment options had Sharpe ratios that were competitive with the industry median. The Cash option’s good performance and low standard deviation resulted in a Sharpe ratio that materially exceeded the industry median.

Insurance

For the assessment of the default insurance we offer members as at 30 June 2021 in our MySuper and choice (super) products we have:

  • Considered whether the premiums paid inappropriately erode retirement benefits
  • Compared the premiums payable to comparable products in the industry
  • Reviewed the claims ratio, which provides an indication of whether the premiums are too high relative to the actual claims experience

The results for these assessments are mixed. Qantas Super has been challenged by insurance affordability when compared with other super funds. We have provided relatively generous default levels of death and total and permanent disablement (TPD) cover, which had previously been less expensive, and default income protection (IP) cover has been valued by our membership; especially by those in occupations which would not be able to obtain cover at reasonable rates (or at all) elsewhere in the market.

The direct impact of the COVID-19 pandemic on Qantas Group and the standing down of the majority of its workforce resulted in significant increases to TPD and IP insurance premiums from 1 August 2020. This has been compounded by a deterioration in the TPD claims experience from 2020 through to early 2021, which will in turn lead to a further increase in TPD insurance premiums with effect from 1 July 2022.

As a result of the above, the Trustee has undertaken a comprehensive insurance benefit design review during 2021 and 2022, with a focus on reducing the insurance premiums paid by members and the resulting erosion of super benefits. This will be achieved by reducing the current generous levels of default death and TPD cover provided to members, which will in turn reduce the cost of default insurance cover to approximately 1.5% of salary on average. These changes are expected to take effect on 1 July 2022.

Premiums do not inappropriately erode members' retirement benefits

Overall, 71% of members have annual death, TPD and IP insurance premiums at or below 1.5% of their salary, which is slightly below the target we set.

Premiums compared to similar products in the industry

Across our Plan as a whole, we observed that:

  • 81% of our members have death insurance premiums at or below the median premium payable for other funds that provide death insurance
  • 15% of our members have TPD insurance premiums at or below the median premium payable for other funds that provide total and permanent disablement insurance
  • 45% of our members have IP premiums at or below the median premium payable for other funds that provide income protection insurance

We consider the insurance premiums to be competitive relative to the market when taking into account the characteristics of our members. In particular, while the premiums for TPD and IP are above the median super fund premium for the majority of our members, many of these members would find it difficult to obtain this cover at similar rates to that offered by Qantas Super, if at all, due to the high risk nature of their occupations from an insurance perspective.

Claims ratio experience

The claims ratio is the percentage of insurance premiums paid out in insurance claims. For example, an 80% claims ratio means that for every $1 of premium members have paid for insurance cover, we’ve paid 80 cents back to members in claims. In relation to our Glidepath and choice members, we observed that the three year average claims ratio for has been:

  • Death cover was 70%, which is slightly below the expected range of 75% to 90%
  • TPD cover was 104%, which is above the expected range of 75% to 90%
  • IP cover was 80%, which is at the top of the expected range of 65% to 80%

The actual claims experience described above is a key input into the insurance premium changes effective 1 July 2022. Overall, these results indicate that the premiums are set at a reasonable level based on the actual claims experience.

Fees and costs

The assessment of fees and costs considers the allocation of costs across the membership and compares the investment fees and non-investment fees to comparable products in the industry.

Based on the results of the assessment, we concluded that there is a fair and reasonable allocation of costs between products, divisions within the Plan, and the different types of members. As a not-for-profit fund, our fees are set at a level to recover these costs.

When considering fees and costs it is important to bear in mind that the benefits, services and facilities offered by funds are different. We are modestly more expensive than some other funds in the market because our offering is tailored to the needs and circumstances of our members; being current and former employees of Qantas Group.

MySuper (Glidepath) product fees and costs

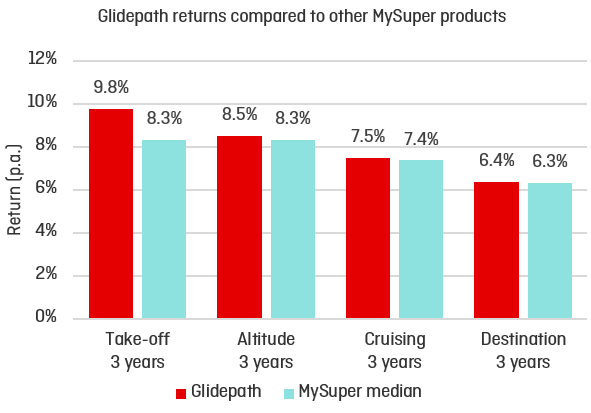
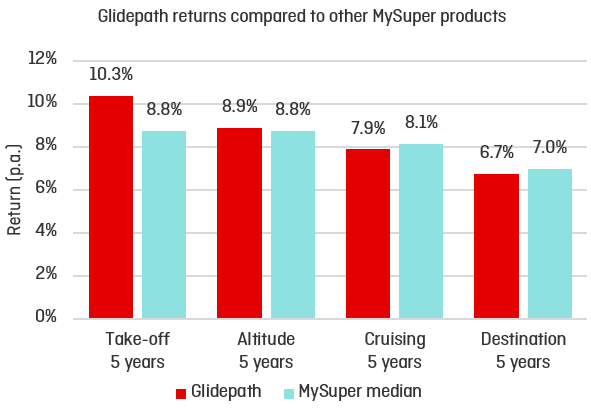
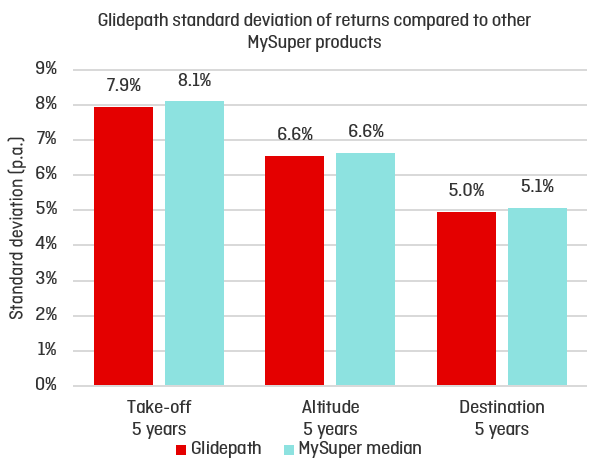
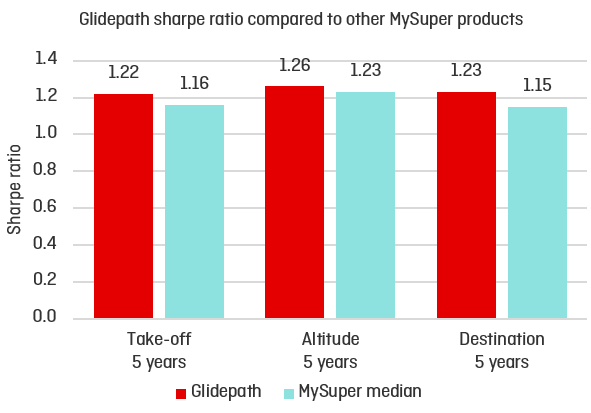
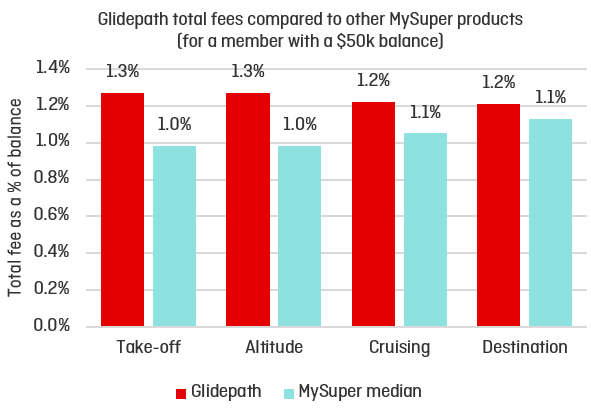
We’ve assessed each stage of our Glidepath investment option separately. We have taken this approach so that each stage can be more easily compared to other MySuper products. The outcomes and metrics on which we based this assessment are largely prescribed by APRA and we are required to use APRA data.

Fees (i.e. which includes investment management fees, investment performance fees and administration fees), for Glidepath are shown below as a percentage of balance for a member with a $50,000 balance (as required by APRA). In general, the Plan targets being good value for money for members. At 30 June 2021 the Plan’s total fees for Glidepath were greater than the median fees of comparable products in the industry. The members of the Plan enjoyed excellent investment performance for the year ending 30 June 2021, which in turn led to an increase in performance fee payments to our external investment managers, and this was a significant contributor to this fee outcome.

In addition, the Plan’s investment fees reflect our well diversified investment strategy, which includes allocations to various alternative sub-asset classes. While the investments within these alternative sub-asset classes have enhanced the return and risk profile of our investment options, they are also more expensive than traditional asset classes.

It is also noted that these results do not reflect the administration fee reductions made with effect 1 July 2021, and so an improvement on this result is expected to have now occurred.

Choice product fees and costs

We used survey data from SuperRatings as the basis for our assessment of our choice product. At a total fee level (i.e. where total fees includes investment management fees, investment performance fees and administration fees), the investment options under our choice product generally have modestly higher fees than comparable products, with the exception being the Cash option.

As described above, the members of the Plan enjoyed excellent investment performance for the year ending 30 June 2021, which in turn led to an increase in performance fee payments to our external investment managers. In addition, the Plan’s investment fees reflect our well diversified investment strategy, which includes allocations to various alternative sub-asset classes, which are generally more expensive than traditional asset classes.

Again, these results do not reflect the administration fee changes made with effect 1 July 2021 and so an improvement on this result is expected to have now occurred.

Fees for choice options are shown below in dollar terms for a member with a (a balance bracket as provided by SuperRatings that is closest to the average balance of members in our choice product).

Options, benefits and facilities

The options, benefits and facilities assessment considers whether our overall product and service offering is appropriate for our members. For this assessment we have considered the rating given to us by SuperRatings and the feedback that we have received from you, our members.

We have maintained our “Gold” rating from SuperRatings for our MySuper and choice products. The Gold rating is consistent with our member value proposition that “Qantas Super delivers the best product and services to meet my needs as a member”.

In our June 2021 member survey, overall satisfaction among members was 7.9 out of 10, which was consistent with the result the previous year. During FY2020/21 members also gave an average rating of 4.4 out of 5 when asked to rate their experience following interactions with our website, call centre and advice team. A rating of ‘1’ indicates a ‘poor’ experience ‘5’ and a rating of indicates an ‘excellent’ experience. We see these as positive results given the challenging year the aviation industry and our members experienced.

Taken together, the SuperRatings assessment and member feedback indicates that overall we are providing appropriate options, benefits and facilities to our members.

The rating is issued by SuperRatings Pty Ltd ABN 95 100 192 283 AFSL 311880 (SuperRatings). Ratings are general advice only and have been prepared without taking account of your objectives, financial situation or needs. Consider your personal circumstances, read the product disclosure statement and seek independent financial advice before investing. The rating is not a recommendation to purchase, sell or hold any product. Past performance information is not indicative of future performance. Ratings are subject to change without notice and SuperRatings assumes no obligation to update. SuperRatings uses objective criteria and receives a fee for publishing awards. Visit superratings.com.au for ratings information and to access the full report. © 2021 SuperRatings. All rights reserved.

Overall size and scale

Overall, based on the outcomes calculated as at 30 June 2021, members are not disadvantaged because of the scale of, and within, the Trustee’s business operations.

We are able to design products specific to the characteristics of our members. The products we offer our members in general are competitive in terms of investments, insurance, and fees against other comparable products. Where the Plan’s products haven’t compared as well, the reasons are known, steps are being taken to improve the outcome for members and the issue did not directly relate to scale. In addition, the outcomes focussing on options, benefits, and facilities generally demonstrate that our members are satisfied that Qantas Super’s offering meets their needs, and their experience when interacting with the fund is positive.

Determination for the period ending 30 June 2021

MySuper product determination

  • The financial interests of members are being promoted by the Trustee
  • The scale of the Trustee’s business operations is not disadvantaging members
  • The MySuper product’s operating costs are not inappropriately affecting the financial interests of members
  • The basis for the setting of fees is appropriate for members
  • The options, benefits and facilities offered are appropriate for members
  • The investment strategy, including the level of investment risk and return target, is appropriate for members
  • The insurance strategy is appropriate for members
  • The insurance fees charged do not inappropriately erode the retirement incomes of members

Choice product determination

  • The financial interests of the members are being promoted by the Trustee
  • The scale of the Trustee’s business operations is not disadvantaging members
  • The choice product’s operating costs are not inappropriately affecting the financial interests of members
  • The basis for the setting of fees is appropriate for members
  • The options, benefits and facilities offered are appropriate for members
  • The investment strategy, including the level of investment risk and return target, is appropriate for members
  • The insurance strategy is appropriate for members
  • The insurance fees charged do not inappropriately erode the retirement incomes of members
Got a question?